Chapter 1.5 — The Toolchain and Its Failure Modes
In one line: Most "the model got slow" incidents are environment incidents, and a fixed ten-minute probe of six contracts rules them out before you touch a line of model code.
| Part | I — The Machine |
| Chapter | 1.5 |
| Time | ~100 min |
| Prereqs | 1.1 Memory hierarchy, 1.2 Roofline, 1.4 Multi-GPU plumbing |
| Notation | \(P_{peak}\), \(B_{mem}\), TPOT |
| Status | built |
Where we are
Chapter 1.4 showed that adding GPUs helps only when the arithmetic saved exceeds the bytes exchanged, and that the exchange cost depends on which physical link the collective traverses. This chapter is the layer underneath: the driver, runtime, clocks, and device mask that decide whether the machine you measured is the machine you think you measured. It closes Part I; Chapter 2.1 opens Part II.
Why this matters
Here is a claim worth defending: most "our inference got slower" incidents are environment incidents, not code incidents, and you can rule the environment out in ten minutes if you know what to look at.
The reasoning is not mystical. Your weights are immutable and your serving code is under version control. The environment — driver version, power cap, thermal state, ECC mode, which physical GPUs the scheduler handed you, what else is resident on the card — changes constantly and without a pull request. All of those produce one dashboard signature: p50 TPOT drifts up, GPU utilisation still reads 100%, logs look clean. Profile the model first and you will spend two days building a correct flame graph of a healthy program running on a sick machine.
The sentence to remember
Before you ask why is this code slow, prove the machine is the machine.
The mental model
The stack is a chain of contracts, each directional. The kernel driver promises the OS it can talk to the device; the driver API promises applications a set of capabilities; the runtime promises the framework a set of primitives; the hardware promises rated clocks unless something stops it.
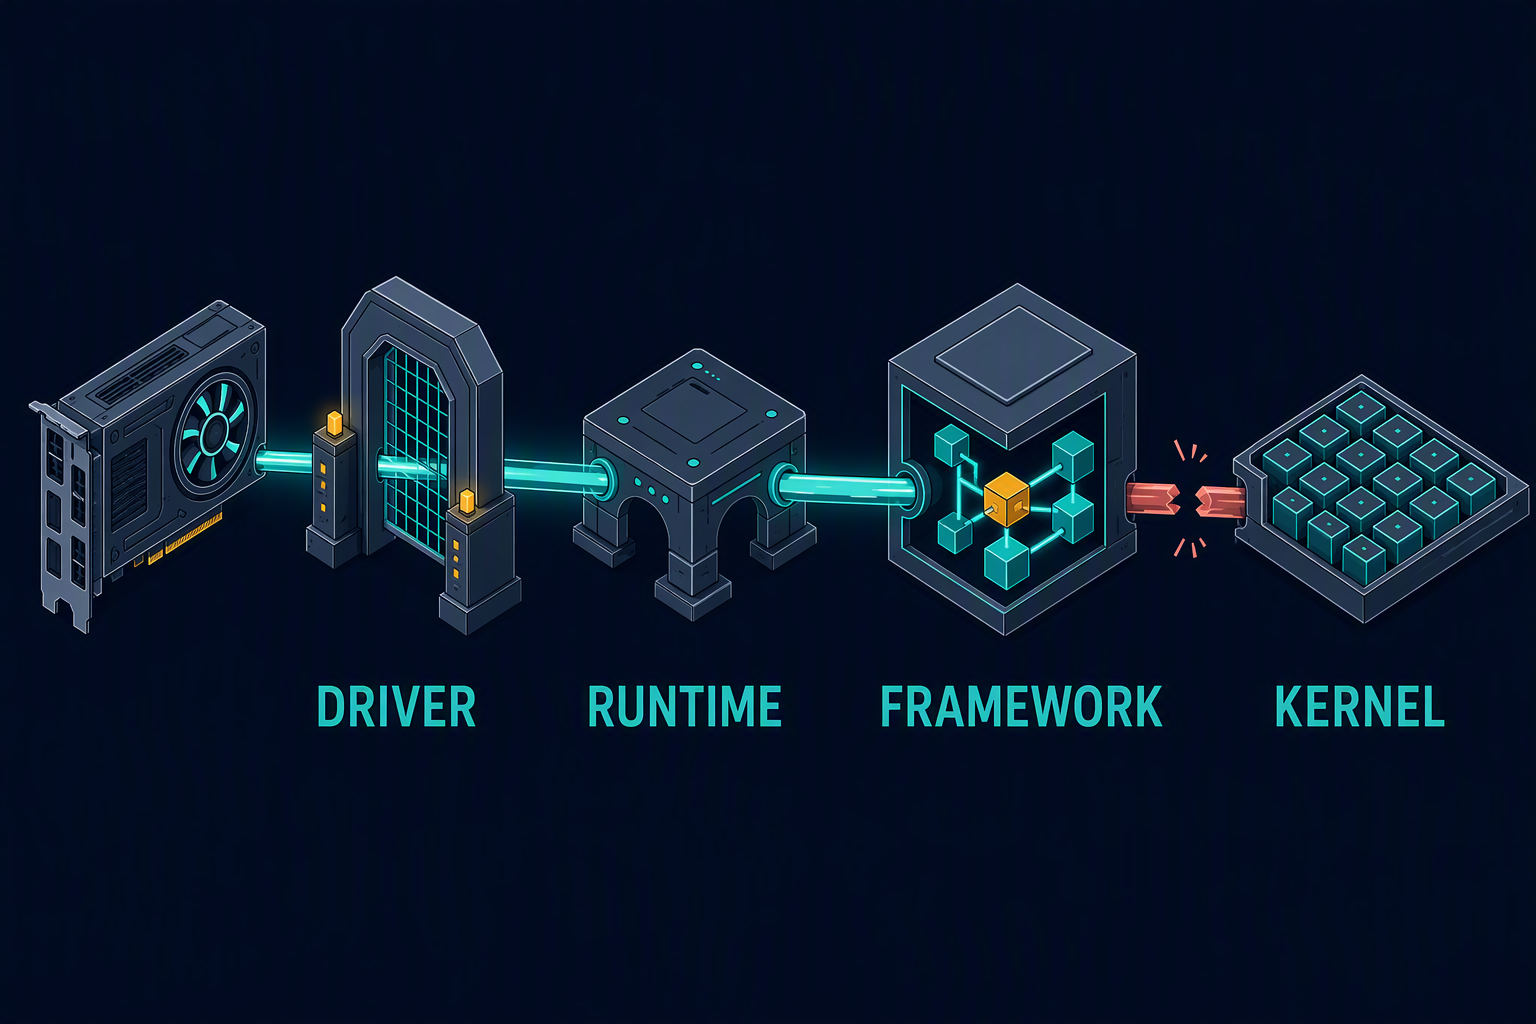
Figure 1.5.1 — One broken link and everything above it is dark, however correct that upper code is.
Only the lowest broken contract carries information. If the driver is unreachable, PyTorch reporting zero devices tells you nothing new. Test bottom-up; stop at the first failure.
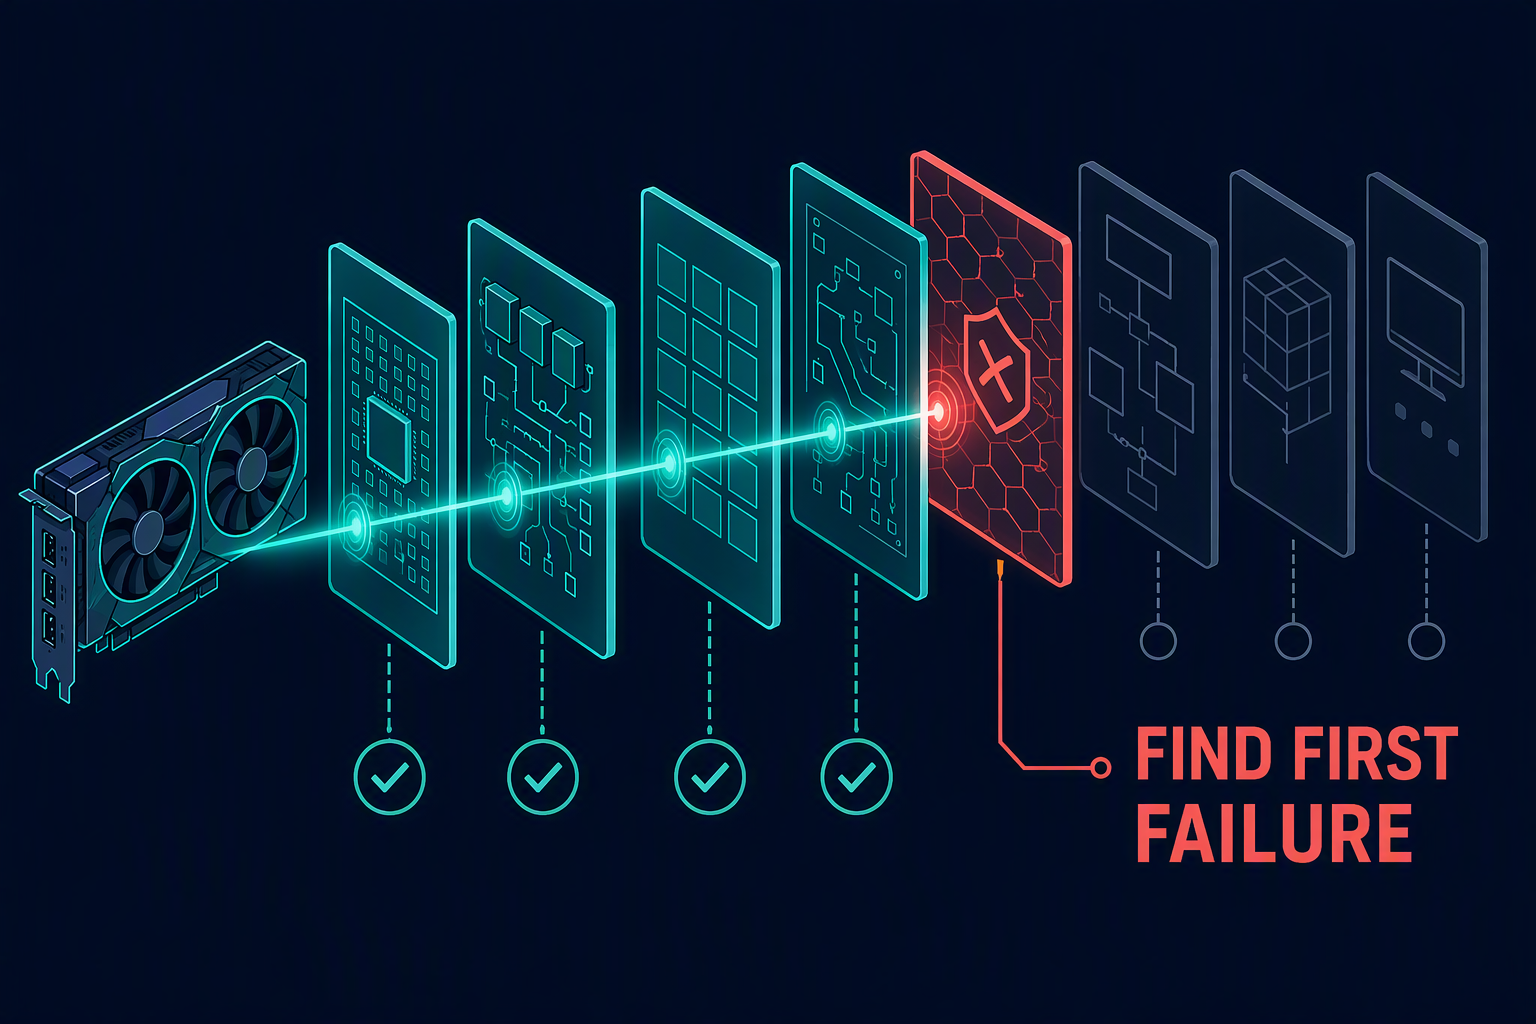
Figure 1.5.2 — Isolate the first broken boundary. Everything above it is a consequence, not a clue.
Contracts fail in two ways. A binary failure means nothing runs — torch.cuda.is_available() is
False, a kernel refuses to launch. Loud, and the easy case. An analogue failure means everything
runs, correctly, slower: throttled clocks, ECC disabled on one host and not another, a topology-hostile
device mask. Those reach production, survive code review, and quietly bill you for GPUs you did not
need.
The mechanism
The contract chain, precisely
People say "install CUDA" as though it were one thing. It is at least four, from different vendors on different schedules.
- The NVIDIA kernel driver (
nvidia.ko). Owns the device; installed by root, tied to the kernel. - The CUDA driver API (
libcuda.so). Ships with the driver, not the toolkit. Its version is the driver's, and it defines what the host can actually do. - The CUDA runtime and math libraries (
libcudart, cuBLAS, cuDNN, NCCL) — bundled inside the pip wheel on a normal PyTorch install. You almost never use the system copy. - The framework, compiled against one runtime family and a fixed list of GPU architectures.
The rule that matters is minor-version compatibility: anything built against a CUDA 12.x runtime
runs on any driver supporting CUDA 12.0 or later — on Linux, roughly R525 and newer. Crossing a major
version does require driver support, unless you deploy the cuda-compat forward compatibility
package, which ships a shim libcuda so a newer stack runs on an older qualified datacentre driver.
This is why nvcc --version is usually irrelevant: it is the compiler from a locally installed
toolkit, and prebuilt wheels never touch it. Likewise the "CUDA Version" in the nvidia-smi header is
the highest runtime API the driver supports — a capability advertisement, not an inventory. A host
can legitimately show CUDA 12.8, have no nvcc, and run a wheel built for CUDA 12.4.
Three one-liners answer three different questions. State which one you are asking:
python -c "import torch; print(torch.__version__, torch.version.cuda)"
python -c "import torch; print(torch.cuda.is_available(), torch.cuda.device_count())"
python -c "import torch; print(torch.backends.cudnn.version(), torch.cuda.get_arch_list())"
torch.version.cuda is the runtime family the wheel was built against — None means a CPU-only
build. torch.cuda.is_available() is whether that build can initialise a device now.
torch.cuda.get_arch_list() is the compiled architecture list; if sm_80 is missing on an A100, kernels
will not launch however healthy the driver is.
flowchart TD
    S["torch.cuda.is_available() is False"] --> A{"nvidia-smi responds?"}
    A -- No --> D["Driver or device access.<br/>Nothing above this can help."]
    A -- Yes --> B{"torch.version.cuda is None?"}
    B -- Yes --> W["CPU-only wheel.<br/>Reinstall the CUDA build."]
    B -- No --> C{"CUDA_VISIBLE_DEVICES set<br/>and non-empty?"}
    C -- No --> V["Device mask hides everything.<br/>Fix the launcher or scheduler."]
    C -- Yes --> M{"Driver major >= runtime major?"}
    M -- No --> F["Upgrade driver, or deploy<br/>forward-compatibility package."]
    M -- Yes --> P["Permissions, container device<br/>mounts, or init error. Read it."]
Figure 1.5.3 — Every branch is a different repair. Guessing between them turns a ten-minute fix into an afternoon of reinstallation.
When "slow" is really "throttled"
A GPU quietly trades clock speed for survival. An A100 80 GB SXM carries a 400 W default board limit and a rated boost SM clock of 1410 MHz, and will not always hold both.
Read the Clocks Event Reasons block (older drivers say Clocks Throttle Reasons). Three lines matter:
| Reason | Meaning | Severity |
|---|---|---|
SW Power Cap : Active |
Board is at its configured power limit; driver is lowering clocks to stay there | Expected under load — unless the cap itself is wrong |
HW Thermal Slowdown : Active |
Temperature crossed a hardware threshold; the device cut clocks itself | Facility problem. Escalate |
HW Power Brake Slowdown : Active |
External signal asserted; typically PSU or rack power delivery | Facility problem. Escalate |
The same fields are queryable in CSV for dashboards:
nvidia-smi --query-gpu=clocks.sm,clocks.max.sm,power.draw,enforced.power.limit,temperature.gpu,clocks_throttle_reasons.active --format=csv
Watch enforced.power.limit, not power.limit. They differ whenever a management agent, a provider
policy, or a stale nvidia-smi -pl lowered the ceiling.
Worked example — the 250 W card that looks like a code regression
Your A100 enforces 250 W instead of the default 400 W.
Dynamic power scales roughly as \(P \propto f V^2\). At fixed voltage, power is linear in frequency, so 62.5% of the budget buys at most 62.5% of the clock. Voltage also falls as the governor lowers frequency, so sustained SM clock lands between roughly 880 MHz and 1410 MHz, and under continuous load much nearer the bottom. An envelope argument, not a measurement.
Now read the dashboard. Compute-bound prefill slows by nearly the fraction the clock lost, because
\(P_{peak}\) scales with clock. Utilisation stays at 100%, because it is a time-busy signal — it says
a kernel was resident, not that it ran fast. Memory, error rate, and logs are unchanged. The
signature is indistinguishable from "someone made the model slower", and exactly one field tells the
truth: SW Power Cap : Active beside an enforced.power.limit of 250 W.
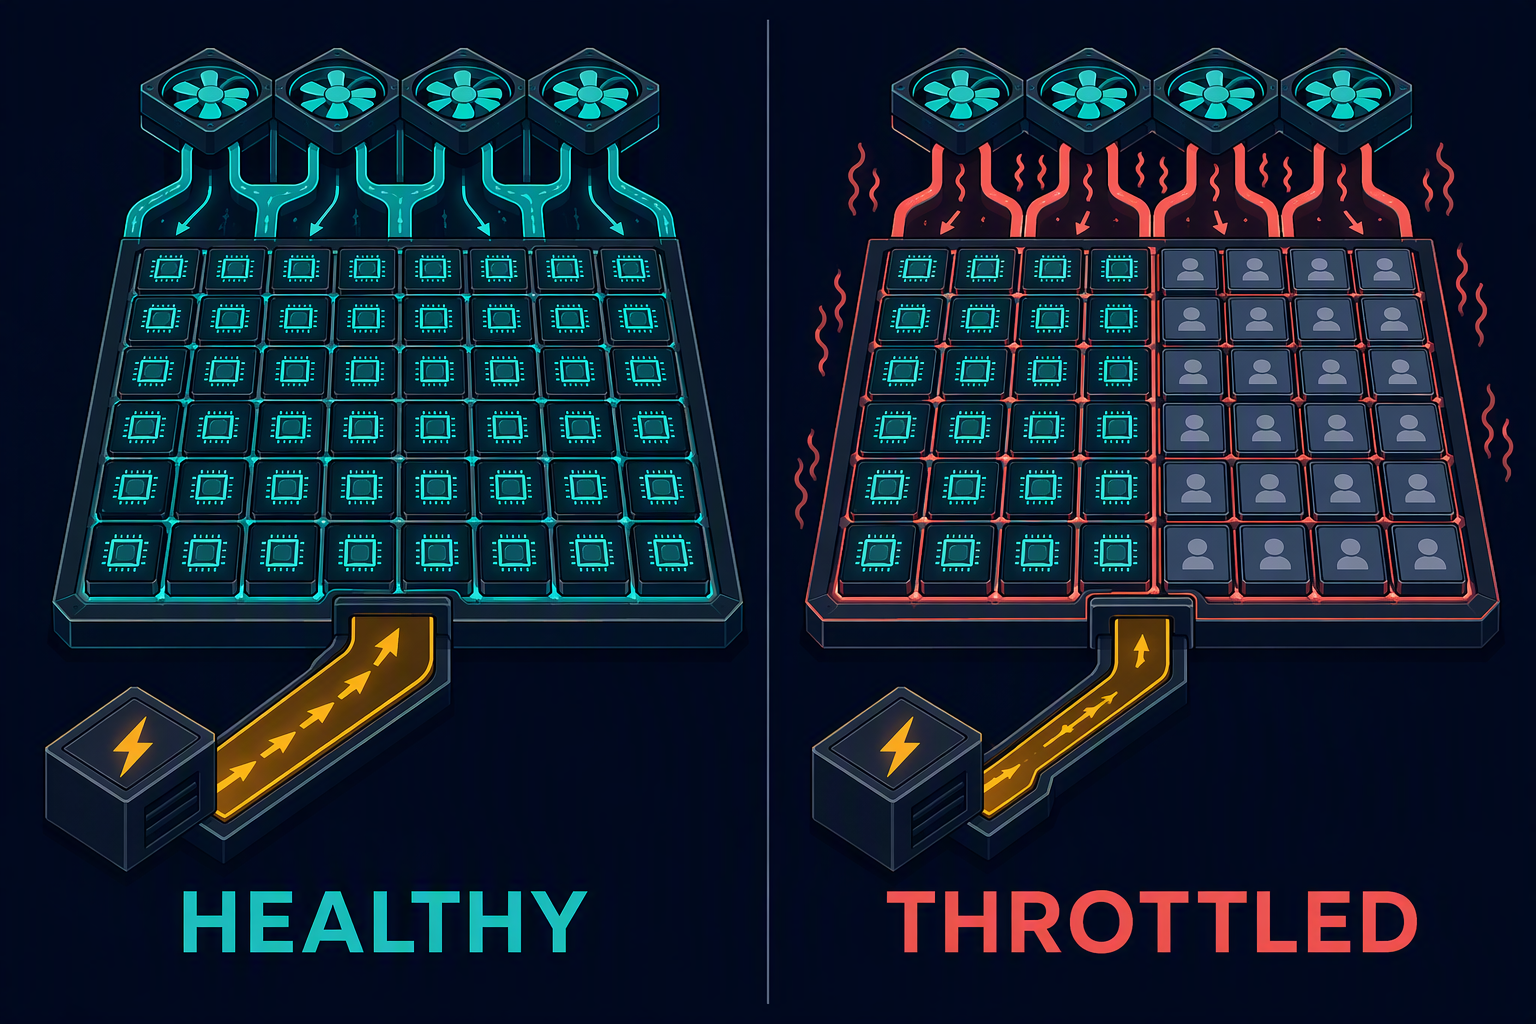
Figure 1.5.4 — Both cards report 100% utilisation. Only one is doing 100% of the work you pay for.
ECC is part of your baseline
Datacentre GPUs ship with ECC (error-correcting memory) on by default. It costs a few percent of usable capacity and effective bandwidth, because parity occupies real cells and real transactions. Without it, a single-bit flip in a 62 GiB KV cache corrupts a customer's output silently.
nvidia-smi --query-gpu=ecc.mode.current,ecc.mode.pending,memory.total --format=csv
nvidia-smi -q -d ROW_REMAPPER      # A100: remapped rows, pending remaps, remap failures
Remapping Failure Occurred : Yes means the card has exhausted its spare rows and needs replacing.
ECC mode silently invalidates cross-host comparisons
A card with ECC disabled reports more usable VRAM and moves bytes marginally faster than an identical
card with ECC on. If one host was set up by someone who disabled ECC to fit a larger batch, every
benchmark comparing that host to another is wrong, in a direction that flatters the misconfigured
machine — so the winning configuration gets promoted, deployed onto ECC-enabled hosts, and OOMs at a
batch size that "worked in testing". Record ecc.mode.current in every results file.
Memory you did not allocate
nvidia-smi shows 11 GiB in use. Your job is not running and nobody is logged in.
This is the orphan-process failure, and the most common cause of "OOM at a batch size that worked yesterday". A crashed notebook kernel, an abandoned worker, or a process in another container's PID namespace still holds a CUDA context. Because the caching allocator needs large usable regions rather than merely sufficient free bytes, you fail well before the arithmetic says you should.
nvidia-smi --query-compute-apps=gpu_uuid,pid,process_name,used_memory --format=csv
sudo fuser -v /dev/nvidia*          # PIDs holding the device nodes, including ones smi misses
sudo lsof /dev/nvidia*              # same question, more detail
Inside a container the PID column is frequently blank — the process lives in a namespace you cannot see. That is the signal to ask the platform owner, not to try harder.
Do not reflexively kill what you find
The PID holding 11 GiB may be a colleague's twelve-hour job, a display server, or a system agent.
Establish PID, user, container, and workload owner before acting. And nvidia-smi --gpu-reset
requires no active contexts and can hang a host that has them — a maintenance-window operation.
Visibility is an index transformation
CUDA_VISIBLE_DEVICES does two things; everyone remembers the first and forgets the second. It
restricts which devices a process sees, and it renumbers them. With CUDA_VISIBLE_DEVICES=3,5,
physical GPU 3 becomes cuda:0 and physical GPU 5 becomes cuda:1, so "cuda:0 failed" is ambiguous
outside the process that wrote it.
nvidia-smi -L                       # index -> name -> UUID, the only stable identifier
nvidia-smi topo -m                  # NV# = NVLink, PIX/PXB/NODE/SYS = progressively worse PCIe paths
This is where Chapter 1.4 bites: tensor parallelism issues an all-reduce at every layer boundary, and its cost is set by the worst link in the group.
Worked example — TP=2 got slower and nothing changed
An 8-GPU node. Yesterday the scheduler gave the job CUDA_VISIBLE_DEVICES=0,1; today,
CUDA_VISIBLE_DEVICES=0,4. The application sees cuda:0 and cuda:1 both times; code and model are
byte-identical.
But nvidia-smi topo -m shows NV12 between physical 0 and 1, and SYS between physical 0 and 4 —
a path that leaves the NVLink fabric and crosses the CPU sockets. Per Chapter 1.4, the bandwidth term
\(n/B\) of every all-reduce is now divided by a far slower link, and you pay it twice per layer, on
every generated token. Nothing in your logs or code says this; the evidence is the device mask
paired with the topology matrix, which is why both belong in your results file.
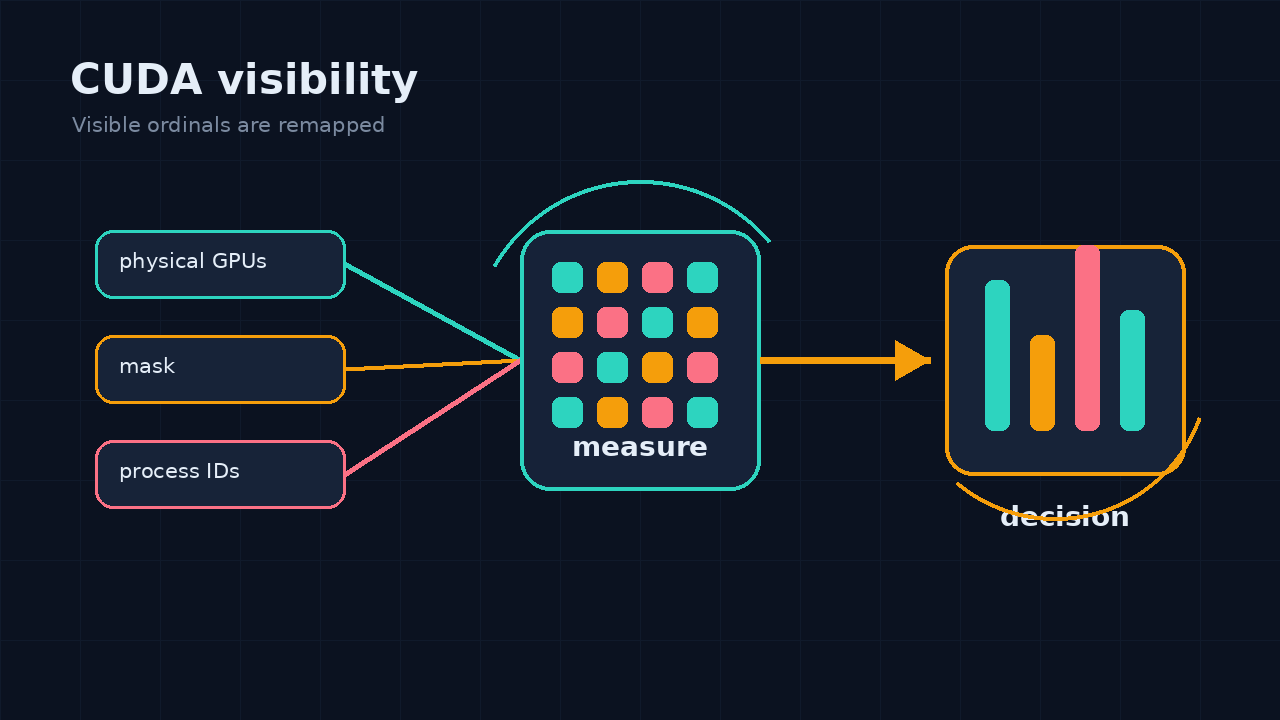
Figure 1.5.5 — Two logical ranks, two physical paths. The application cannot tell; your token rate can.
MIG (Multi-Instance GPU) partitions one A100 into up to seven hardware-isolated instances, each with its own SM, L2, and memory slice. Instances are addressed by MIG UUIDs rather than integers, and have no peer-to-peer path between them — tensor parallelism across MIG slices is impossible. This curriculum uses MIG later to carve the cluster for the Kubernetes labs.
On newer silicon
Minimum driver versions move with each architecture: Hopper (H100, SM 9.0) needs R525-series or newer, Blackwell R570-series or newer. A driver that runs your A100 fleet perfectly will simply not enumerate a newer card, and the symptom is an empty device list rather than a message.
Hopper and Blackwell also add confidential computing modes, which encrypt traffic across the PCIe boundary and change both the performance profile and what management tools may report. None of it applies on A100 (SM 8.0) — but on an H100 fleet, "CC mode is on" belongs on your triage list: it is invisible from inside the container and not free.
In practice
Run this top to bottom, in order, before you profile anything.
| # | Question | Command | Field to read |
|---|---|---|---|
| 1 | Is the driver reachable? | nvidia-smi |
Header driver version; any error at all stops you here |
| 2 | Which physical devices am I holding? | echo $CUDA_VISIBLE_DEVICES; nvidia-smi -L |
Map every local ordinal to a UUID |
| 3 | Is the framework the right build? | python -c "import torch; print(torch.version.cuda, torch.cuda.is_available(), torch.cuda.get_arch_list())" |
None ⇒ CPU wheel; missing sm_80 ⇒ kernels will not launch |
| 4 | Is anyone else on my card? | nvidia-smi --query-compute-apps=pid,used_memory --format=csv |
Non-empty when it should be empty |
| 5 | Am I being throttled? | nvidia-smi -q -d PERFORMANCE |
SW Power Cap, HW Thermal Slowdown, HW Power Brake |
| 6 | Is my power ceiling what I think? | nvidia-smi --query-gpu=enforced.power.limit,clocks.sm,clocks.max.sm --format=csv |
enforced.power.limit ≠ default ⇒ found it |
| 7 | Is memory healthy and comparable? | nvidia-smi --query-gpu=ecc.mode.current --format=csv and nvidia-smi -q -d ROW_REMAPPER |
ECC mode; Remapping Failure Occurred |
| 8 | Is my topology what the run assumed? | nvidia-smi topo -m |
SYS or NODE between ranks that should be NV# |
flowchart TD
    Q["Symptom: slower than yesterday"] --> T1{"Throttle reasons active?"}
    T1 -- Yes --> R1["Power cap or thermal.<br/>Facility or config, not code."]
    T1 -- No --> T2{"Foreign process on device?"}
    T2 -- Yes --> R2["Reclaim capacity.<br/>Find the owner first."]
    T2 -- No --> T3{"Device mask same as baseline?"}
    T3 -- No --> R3["Check topo -m.<br/>Collectives may cross PCIe."]
    T3 -- Yes --> T4{"ECC mode same as baseline?"}
    T4 -- No --> R4["Comparison is invalid.<br/>Rebaseline."]
    T4 -- Yes --> R5["Environment is clean.<br/>Now profile the model."]
Figure 1.5.6 — Four questions stand between a symptom and a justified decision to profile. One path out of five ends in "it is your code".
Two habits make this durable. Archive the evidence with the measurement — the
artifact emits results/health.json, so "what changed
between the fast run and the slow run?" becomes a diff rather than an argument. Capture it twice,
idle and under load: idle clocks are supposed to be low, and only the loaded sample says anything about
throttling.
For fleets, DCGM does this continuously: dcgmi diag -r 1 is a fast, safe health check, while
dcgmi diag -r 3 runs invasive stress tests — never on a serving card.
Failure modes
| Symptom / literal message | Cause | Fix |
|---|---|---|
torch.cuda.is_available() returns False, nvidia-smi works fine |
CPU-only wheel, or an empty/incorrect device mask | Read torch.version.cuda. None ⇒ reinstall the CUDA build. Otherwise check CUDA_VISIBLE_DEVICES and container device mounts |
CUDA driver version is insufficient for CUDA runtime version |
Runtime major version exceeds what the driver supports | Upgrade the driver, install a wheel built for an older CUDA major, or deploy the forward-compatibility package on datacentre GPUs |
no kernel image is available for execution on the device |
The binary has no code for your compute capability — usually an extension built without sm_80 |
Check torch.cuda.get_arch_list(); rebuild with the architecture in TORCH_CUDA_ARCH_LIST |
CUDA out of memory at a batch size that worked yesterday |
Another process holds VRAM, or a stale context fragments what remains | nvidia-smi --query-compute-apps, then fuser -v /dev/nvidia*. Identify the owner before reclaiming |
| Throughput down ~25%, GPU utilisation still 100% | Clocks pulled down by SW Power Cap or thermal slowdown |
nvidia-smi -q -d PERFORMANCE; compare enforced.power.limit and clocks.sm against a known-good capture |
| TP=2 run slower than last week, same code and model | Scheduler assigned GPUs on a different topology path | nvidia-smi topo -m for the assigned UUIDs; SYS/NODE between ranks means collectives left NVLink |
Two "identical" hosts report different memory.total |
ECC mode or MIG partitioning differs | ecc.mode.current and nvidia-smi -L; rebaseline, do not average across them |
| First request after a scale-up takes seconds longer than steady state | Persistence mode off, so each new process pays driver initialisation | nvidia-smi -pm 1 on the host, and warm the model before opening the load balancer |
Do it
Run the read-only diagnostic artifact on your target
host. It captures driver, framework build, device mask, topology, active processes, clocks, ECC, and
retirement state into results/health.json and a readable results/health-report.md. It changes
nothing: remediation follows diagnosis, because clock, ECC, and persistence changes affect other tenants
and some require a reset window.
Success criterion. Two parts, both objective:
- Run it once idle and once during a load test, then
diffthe JSON files. You should be able to point at the fields that prove the card was or was not throttled. - Inject one safe fault — a child shell with
CUDA_VISIBLE_DEVICES=""— and confirm the report names that broken contract rather than a downstream consequence.
The committed run in results/ is itself a broken chain: nvidia-smi: not found and torch 2.13.0+cpu
with built_cuda: null. Two contracts failed, the lower one first.
Then close the loop with LAB-M1, the provenance envelope around every performance number in Part I.
Summary
- The stack is a chain of contracts — kernel driver →
libcuda→ bundled runtime → framework. Only the lowest broken contract carries information. - A CUDA 12.x wheel runs on any driver supporting 12.0+.
nvcc --versiondescribes a compiler you are probably not using; thenvidia-smiheader shows driver capability, not installed toolkit. - Throttling is the perfect crime: it looks exactly like a code regression, and
Clocks Event Reasonsplusenforced.power.limitare the only fields that testify. - Record ECC mode, MIG partitioning, and the physical GPUs behind your device mask, or your benchmarks are not comparable — including to your own from last week.
- The triage ends in a named environmental cause or in earned permission to profile the model. Both are wins.
Closing Part I
Six chapters built one object: an accurate mental model of the machine. 1.0 established how work is scheduled — warps, SMs, launch overhead. 1.1 showed that the memory hierarchy, not the arithmetic units, sets the pace. 1.2 turned that into the roofline. 1.3 made precision a first-class choice, because bytes moved is the currency the roofline spends. 1.4 extended the argument past one device, where the interconnect becomes the slowest level of the hierarchy. And 1.5 insisted that all of it is only true if the environment is what you believe.
Part II stops describing hardware and starts describing the workload, applying the roofline to a transformer. You already own the tool; Part II tells you where to point it.
Key terms
ECC · NVLink · SM · all-reduce · TPOT
Exercises
Recall
nvidia-smiprints "CUDA Version: 12.8",nvcc --versionreports 12.4, andtorch.version.cudareports12.1. Which of the three, if any, indicates a problem? Say what each field describes.- Name the three clock-event reasons that distinguish a correctly configured power cap from a facility fault, and say which should page someone.
Derive
- A host enforces 300 W on an A100 whose default is 400 W. Using \(P \propto f V^2\), bound the sustained SM clock as a fraction of the 1410 MHz rating, and say why the true value sits inside that bound rather than at its lower edge. Then say whether prefill or decode degrades more.
- A job launched with
CUDA_VISIBLE_DEVICES=2,6logsRuntimeErroroncuda:1. Which commands, in which order, identify the physical device and prove whether the pair shares an NVLink path?
Design
- You own a 40-node A100 fleet. Over six weeks, p99 TTFT has drifted up ~18% with no deploys. Design a detection scheme that would have caught this in week one: what you collect, what you compare against, what triggers an alert, and what you deliberately do not alert on.
Worked solutions
**1.** None indicates a problem. The `nvidia-smi` header is the highest CUDA runtime API the **driver** supports — a capability ceiling, not an inventory. `nvcc --version` is a locally installed **toolkit compiler**, which prebuilt wheels never invoke. `torch.version.cuda` is the runtime family the **wheel was built against**, and 12.1 is covered by minor-version compatibility under a driver advertising 12.8. **2.** `SW Power Cap` — the driver lowering clocks to respect the configured board limit; expected under load, so investigate the *limit*, not the throttle. `HW Thermal Slowdown` and `HW Power Brake Slowdown` are facility faults and should page someone. **3.** 300/400 = 0.75. At fixed voltage, dynamic power is linear in frequency, so the budget buys at most 75% of the clock: a floor near $0.75 \times 1410 \approx 1058$ MHz, ceiling 1410 MHz. The true value sits above the floor because the governor lowers **voltage** as well as frequency, and the $V^2$ term returns more headroom than the linear frequency term consumes. Prefill degrades more: it is compute-bound (Chapter 1.2) and $P_{peak}$ scales directly with SM clock, while decode at low batch follows the memory clock, which the governor cuts less aggressively. Expect TTFT to move sharply and TPOT less — a diagnostic signature in itself. **4.** `cuda:1` is the **second entry in the mask**, so physical GPU 6. Report the UUID, not the ordinal. Then read the (2, 6) cell of the topology matrix: `NV#` is an NVLink path; `PIX`/`PXB`/`NODE`/`SYS` are progressively worse PCIe routes. **5.** Collect per GPU at ~10-second resolution: `clocks.sm`, `enforced.power.limit`, `clocks_throttle_reasons.active`, `temperature.gpu`, `ecc.mode.current`, driver version, and the device UUIDs assigned to each serving pod. A handful of scalars, cheap enough to keep for months — which is what makes six-week drift visible at all. Compare against a **per-host baseline captured when the host entered the fleet**, not a fleet average. Averages hide exactly this failure: as more hosts degrade, the average degrades with them and nothing looks anomalous. Alert on `enforced.power.limit` differing from the intended value, any hardware slowdown reason, any change in `ecc.mode.current`, any unapproved driver version, and sustained `clocks.sm` below a fixed floor while serving. Do **not** alert on `SW Power Cap : Active` alone — a healthy, fully loaded A100 sits there routinely, and paging on it trains everyone to ignore the channel. Per-host baselines let you name and drain the degraded subset rather than conclude that "the model got slower".Going deeper
- NVIDIA CUDA Compatibility — minor-version and forward compatibility, authoritatively
- NVIDIA System Management Interface — the full query field list, including every throttle reason
- NVIDIA DCGM documentation — field watches and diagnostic levels, with their blast radius stated
- NVIDIA MIG User Guide — instance profiles and isolation boundaries
- CUDA Environment Variables —
CUDA_VISIBLE_DEVICESordering semantics
Next: Chapter 2.1 — Anatomy of a Decoder Block opens Part II. The hardware argument is complete; from here, every cost is a property of the workload running on it.